The Data Table Widget
A spreadsheet-style widget that renders a Table value as a grid of
live-subscribed cells. Columns are typed: each one picks the editor
(text, toggle, pick-list, spinner), visualization (progress bar,
sparkline), or action (button) that cells should use. Row sort, row
filter, column widths, and the selection set are all controlled from
graphix — the widget is the rendering surface and the subscription
manager, nothing more.
The Table value is the single source of truth for what columns
exist, in what order, and how each one is sourced. Columns are
declared as either bare strings (shorthand for a default Text column
with `Netidx source named after the string) or full
ColumnSpec structs. Bare strings let the output of
sys::net::list_table (which has columns: Array<string>) flow
straight through; mixed arrays are fine.
Rows that are absolute netidx paths trigger live subscriptions for
every column whose source is `Netidx. Non-absolute row names
render as virtual rows. Columns whose source is a string or
Map<string, Any> skip subscription entirely and read their values
from the source ref.
Interface
type SortDirection = [`Ascending, `Descending];
type SortBy = { column: string, direction: SortDirection };

type ColumnType = [
    `Text({ on_edit: [fn(#path: string, #value: Any) -> Any, null] }),
    `Toggle({ on_edit: [fn(#path: string, #value: bool) -> Any, null] }),
    `Combo({
        choices: Array<{ id: string, label: string }>,
        on_edit: [fn(#path: string, #value: string) -> Any, null]
    }),
    `Spin({
        min: f64,
        max: f64,
        increment: f64,
        on_edit: [fn(#path: string, #value: f64) -> Any, null]
    }),
    `Progress,
    `Button({
        on_click: [fn(#path: string, #value: Any) -> Any, null]
    }),
    `Sparkline({
        history_seconds: f64,
        min: [f64, null],
        max: [f64, null]
    })
];

type Source = [`Netidx([null, string]), string, Map<string, Any>];

type ColumnSpec = {
    name: string,
    typ: ColumnType,
    display_name: [string, null],
    source: &Source,
    on_resize: &[fn(x: f64) -> Any, null],
    width: &[f64, null]
};

type Table = {
    rows: Array<string>,
    columns: Array<[string, ColumnSpec]>
};

val data_table: fn(
    ?#sort_by: &Array<SortBy>,
    ?#selection: &Array<string>,
    ?#show_row_name: &bool,
    ?#on_select: [fn(#path: string) -> Any, null],
    ?#on_activate: [fn(#path: string) -> Any, null],
    ?#on_header_click: [fn(#column: string) -> Any, null],
    ?#on_update: [fn(#path: string, #value: Primitive) -> Any, null],
    #table: &Table
) -> Widget;

val text_column: fn(
    #name: string,
    ?#on_edit: [fn(#path: string, #value: Any) -> Any, null],
    ?#display_name: [string, null],
    ?#source: &Source,
    ?#on_resize: &[fn(x: f64) -> Any, null],
    ?#width: &[f64, null]
) -> ColumnSpec;
// (toggle_column, combo_column, spin_column, progress_column,
//  button_column, sparkline_column have the same shape — each takes
//  #name plus its kind-specific args, and accepts the same source /
//  width / on_resize options.)
data_table Parameters
-
#table– The table shape:{ rows: Array<string>, columns: Array<[string, ColumnSpec]> }.sys::net::list_table(path)produces a value whosecolumns: Array<string>unifies with this type via the union element. The caller owns the shape: to filter, sort, hide, or reorder rows and columns — or to attach customColumnSpecs to specific columns — build theTablerecord in graphix and hand the result todata_table. Every change to this ref is reconciled against the current subscription set. -
#sort_by– Array of sort keys applied in order. The first is the primary sort; later keys break ties. Empty list (the default) preserves theTable’s row order. Sort values come from the column’s source — a live subscription when source is`Netidx, or the source’s stored value otherwise. -
#selection– Controlled set of selected cell paths. For cells in the row-name column this is just"row_path"; for every other cell it is"row_path/col_name". The widget’s own click / keyboard handlers never mutate this ref directly — they fire#on_selectand#on_activatecallbacks that the caller uses to drive the ref however they want (single-select, multi-select, toggle, etc.). -
#show_row_name– Whentrue(the default) a synthesized leftmost column shows each row’s basename (Path::basename(row)). Setfalsefor tables where the row identity is already carried by a regular column. -
#on_select– Fired whenever a cell is clicked or keyboard navigation lands on a cell. The callback receives the full cell path ("row_path/col_name"for data cells,"row_path"for the row-name column). -
#on_activate– Fired when the user clicks a row-name cell or presses Enter while a row is selected. Receives the row path. -
#on_header_click– Fired when the user clicks a data column’s header label. Receives the column name. -
#on_update– Fired once per subscription update on every cell — useful when you want to mirror live values into graphix state (e.g. re-derive an aggregate) without subscribing separately. Receives the cell path and new value.
Column Types
Each ColumnSpec carries a typ: ColumnType picked with one of the
helper constructors. All constructors take #name: string plus
their kind-specific args (#on_edit / #on_click / #choices /
etc.) and the common appearance options (#display_name, #source,
#width, #on_resize).
-
text_column– Plain text. Withon_editthe cell becomes editable: clicking a selected cell opens a text field;Entercommits the typed value viaon_edit,Escapecancels. The widget attempts to parse the buffer as a typed graphix value; if parsing fails the raw string is sent instead, so users can enterhellowithout quotes. -
toggle_column– Renders a toggler. Cell values"true"or"1"turn it on. Withon_editthe user can flip the toggle. -
combo_column– Drop-down with a fixed set ofchoices. Each choice has anid(the raw value published / sent back throughon_edit) and alabel(what the user sees). -
spin_column– Numeric spinner withmin,max, andincrementbounds;on_editreceives the clamped new value. -
progress_column– Read-only progress bar. Cell values are clamped to[0, 1]. -
button_column– Each cell renders as a button labelled with the cell’s current value.on_clickfires with the cell path and current value. -
sparkline_column– Rolling-line visualization accumulating published values overhistory_seconds. By default the y-axis is shared across every cell in the column (auto-scaled to the union of all rows’ values) so cells are visually comparable. Pass#min/#maxto fix the axis instead.
Column Widths and Resizing
Widths are controlled by two refs per column:
-
width: &[f64, null]– WhenSome(f64)the column is pinned to that width (and the resize handle at the column header vanishes unless anon_resizecallback is also set). Whennullthe column auto-sizes to its content, with a per-column cap (default 300px). -
on_resize: &[fn(x: f64) -> Any, null]– Fired while the user drags a column header’s right edge. The callable receives the new pixel width. The reference is a&field so the callable can be swapped, nulled, or initialized reactively.
Double-clicking any column’s resize handle auto-fits every column to the widest cell in the entire table (not just the visible window).
Source: Where Cell Values Come From
Each ColumnSpec.source is a &Source ref that decides where the
column’s per-cell values originate:
`Netidx(placeholder)– The column subscribes to<row_path>/<column_name>for every row whose path is absolute. Cell values come from the subscription. Theplaceholderpayload (nullor a string) is the text rendered before the subscription resolves and any time it goesUnsubscribedafterward — useful for distinguishing “not yet subscribed” / “lost” from a real blank value.`Netidx(null)is the default for the column-builder helpers and the implicit behavior for bare-string entries inTable.columns.string– A uniform value: every cell in the column renders this text. No subscription. Useful for static fields and computed columns where one value applies to all rows.Map<string, Any>– Per-row values keyed by the row’s basename. No subscription. Rows without a matching key render blank. Useful for “calculated” columns whose values are derived in graphix.
When the source ref updates reactively (e.g. the map changes), the widget re-reads it and refreshes the affected cells. Sparkline columns additionally push each new numeric source value into the rolling history, so a virtual-column sparkline fed from graphix state accumulates points the same way a subscribed one does.
Keyboard Navigation
The widget is focusable: clicking into it grants keyboard focus.
Arrow keys move the selection (the currently-rendered selected cell
scrolls into view as needed). Enter on a row-name cell fires
on_activate; Space on an editable cell opens its editor;
Escape cancels an in-progress edit.
Examples
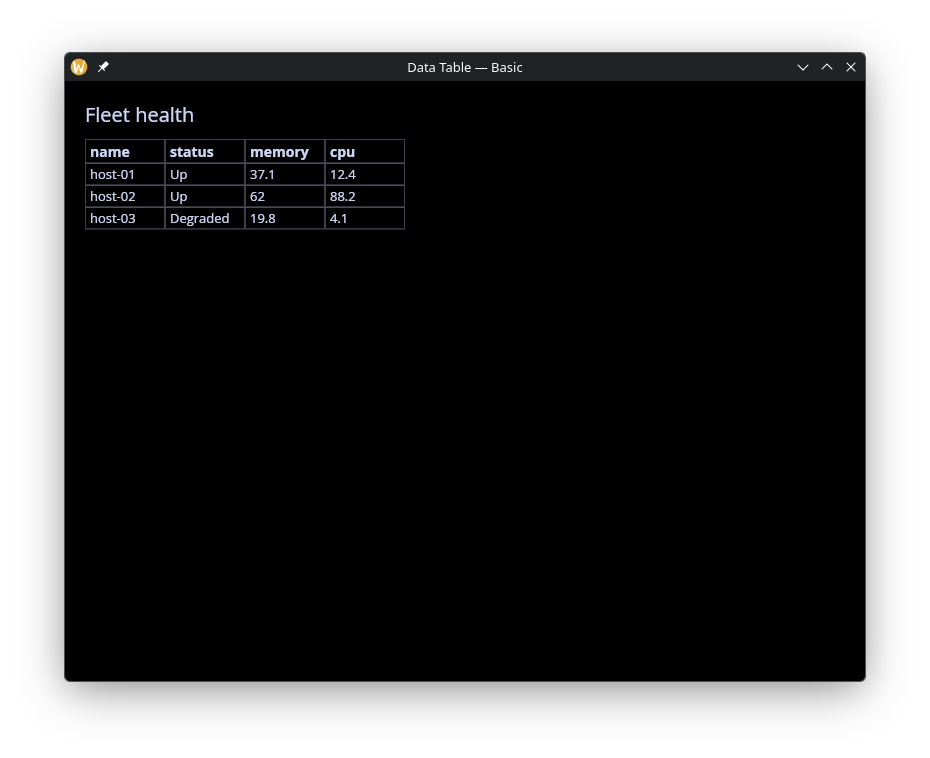
Basic
Minimal usage: publish three hosts and hand the
sys::net::list_table output to data_table with no column
configuration. Bare-string columns become default Text columns with
`Netidx source.
use gui;
use gui::data_table;
use gui::column;
use gui::text;
use sys;
use sys::net;
mod icon;

let publish_host = |#name: string, #status: [`Up, `Degraded], #cpu: f64, #mem: f64| {
    sys::net::publish("/local/graphix/data_table_basic/[name]/status", status);
    sys::net::publish("/local/graphix/data_table_basic/[name]/cpu", cpu);
    sys::net::publish("/local/graphix/data_table_basic/[name]/memory", mem);
};

publish_host(#name: "host-01", #status: `Up, #cpu: 12.4, #mem: 37.1);
publish_host(#name: "host-02", #status: `Up, #cpu: 88.2, #mem: 62.0);
publish_host(#name: "host-03", #status: `Degraded, #cpu: 4.1, #mem: 19.8);

// list_table inspects the resolver to discover children of this path.
let tbl = sys::net::list_table("/local/graphix/data_table_basic")$;

let layout = column(
    #spacing: &12.0,
    #padding: &`All(20.0),
    #width: &`Fill,
    #height: &`Fill,
    &[
        text(#size: &20.0, &"Fleet health"),
        data_table(#table: &tbl)
    ]
);

[&window(
    #icon: &icon::icon,
    #title: &"Data Table — Basic",
    #theme: &`CatppuccinMocha,
    &layout
)]
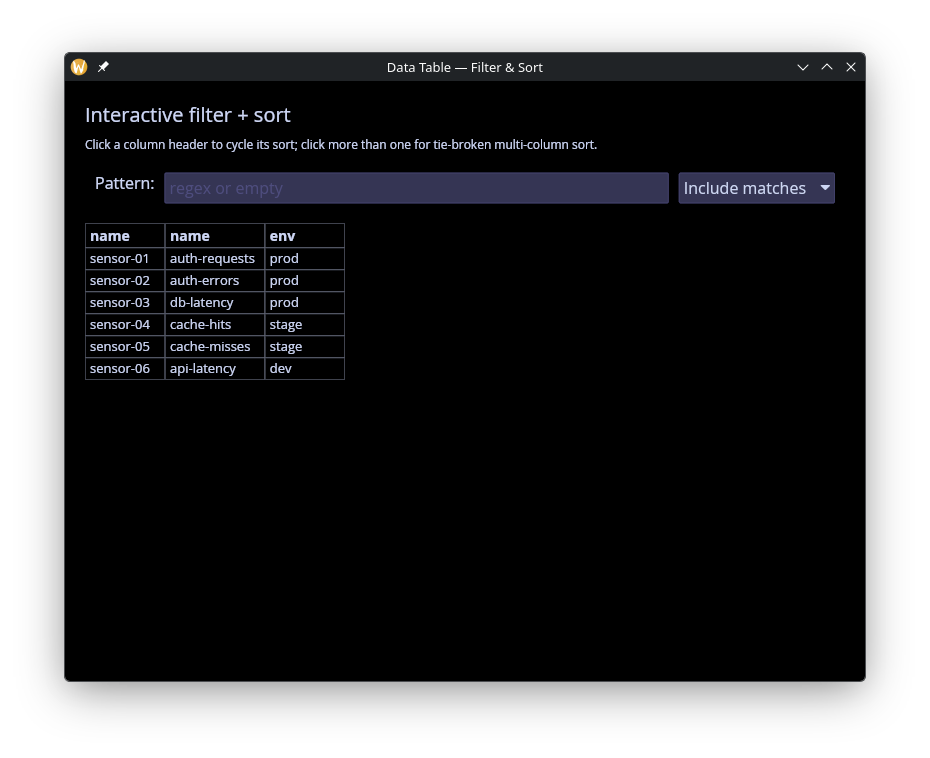
Filter and Sort
Row filtering (a regex over basenames) and sort configuration done
in graphix before the Table is handed to the widget. Shows how the
caller owns the data pipeline end to end.
use gui;
use gui::data_table;
use gui::row;
use gui::column;
use gui::text;
use gui::text_input;
use gui::pick_list;
use array;
use opt;
use re;
use str;
use sys;
use sys::net;
mod icon;

// Publish 6 sensors across three environments; the sidebar controls
// let the user pick a row filter mode. Sorting is driven entirely
// from the table itself — click a header to cycle its sort order.
sys::net::publish("/local/graphix/data_table_filter/sensor-01/name", "auth-requests");
sys::net::publish("/local/graphix/data_table_filter/sensor-01/env", "prod");
sys::net::publish("/local/graphix/data_table_filter/sensor-02/name", "auth-errors");
sys::net::publish("/local/graphix/data_table_filter/sensor-02/env", "prod");
sys::net::publish("/local/graphix/data_table_filter/sensor-03/name", "db-latency");
sys::net::publish("/local/graphix/data_table_filter/sensor-03/env", "prod");
sys::net::publish("/local/graphix/data_table_filter/sensor-04/name", "cache-hits");
sys::net::publish("/local/graphix/data_table_filter/sensor-04/env", "stage");
sys::net::publish("/local/graphix/data_table_filter/sensor-05/name", "cache-misses");
sys::net::publish("/local/graphix/data_table_filter/sensor-05/env", "stage");
sys::net::publish("/local/graphix/data_table_filter/sensor-06/name", "api-latency");
sys::net::publish("/local/graphix/data_table_filter/sensor-06/env", "dev");

let raw_tbl = sys::net::list_table("/local/graphix/data_table_filter")$;

// Filter controls: a regex pattern and whether it includes or excludes.
// The caller reshapes the Table in graphix before passing it in.
let pattern = "";
let mode: [`Include, `Exclude] = `Include;

let tbl: Table = raw_tbl;
tbl <- select str::len(pattern) {
    n if n == 0 => raw_tbl,
    _ => {
        let name_of = |r: string| opt::or_default(str::basename(r), r);
        let matches = |r: string| opt::or_default(
            re::is_match(#pat: pattern, name_of(r))$, false);
        let keep = |r: string| select mode {
            `Include => matches(r),
            `Exclude => !matches(r)
        };
        { raw_tbl with rows: array::filter(raw_tbl.rows, keep) }
    }
};

// Sort state: an array of (column, direction) pairs applied in order.
// The first entry is the primary sort, subsequent entries break ties.
// `cycle_sort` rotates a column through the three states a spreadsheet
// user expects: absent → ascending → descending → absent.
//
// Clicking a column that isn't in `sort_by` appends it as ascending,
// so sort_by grows as the user clicks new columns — that's how multi-
// column sort is demonstrated. The first click on a column that is
// already sorted flips its direction; a second click removes it.
let sort_by: Array<SortBy> = [];

// CR claude for estokes: the `column ~ { ... }` sampling and the
// `matches[0]$` + separate `let dir = m0.direction` split are both
// workarounds for sharp edges in graphix reactivity / parsing:
//
//   1. Without `column ~` on the RHS of `sort_by <-`, the compiled
//      dataflow evaluates `array::filter(sort_by, ...)` at its
//      initial empty sort_by value and never re-fires on callback
//      invocation — so the callback appears to do nothing.
//      The lang reference already documents that `~` is required in
//      callbacks to sample current state at event time; this example
//      makes that concrete.
//
//   2. `array::find` hits a MapQ fast-path in graphix-package-core
//      (`MapQ::update`, around lib.rs:679) that returns the empty
//      input array for an empty collection instead of calling
//      `finish()`. For HOFs whose element-returning `finish()` would
//      produce a different type than the collection (find → Option,
//      find_map → Option), the fast-path returns the wrong type —
//      so `array::find(<empty>, pred)` emits `[]` instead of `null`
//      and the null arm of the outer select never fires. The
//      `array::filter` + `array::len` pair below sidesteps this
//      because filter's natural "empty → empty" happens to match
//      its output type.
//
//   3. `matches[0]$.direction` fails to parse — the `$` error-drop
//      postfix followed immediately by `.field` confuses the parser
//      into reporting the outer callsite as unexpected, which is a
//      red herring. Binding `matches[0]$` to a local first parses
//      cleanly.
//
// Also, every lambda needs `|sb: SortBy|` annotations (and the `map`
// callback needs `-> SortBy`) because graphix narrows sort_by's
// element type based on the `direction: `Ascending` literal in the
// push arm and then rejects `sb.direction` elsewhere as non-matching.
let cycle_sort = |#column: string|
    sort_by <- column ~ {
        let matches = array::filter(sort_by, |sb: SortBy| sb.column == column);
        let n = array::len(matches);
        let m0 = matches[0]$;
        let dir: SortDirection = m0.direction;
        select n {
            0 => array::push(sort_by, { column: column, direction: `Ascending }),
            _ => select dir {
                `Ascending => array::map(sort_by, |s: SortBy| -> SortBy
                    select s.column == column {
                        true => { s with direction: `Descending },
                        false => s
                    }),
                `Descending => array::filter(sort_by, |s: SortBy| s.column != column)
            }
        }
    };

let controls = row(
    #spacing: &10.0,
    #padding: &`All(10.0),
    &[
        text(&"Pattern:"),
        text_input(
            #on_input: |v: string| pattern <- v,
            #placeholder: &"regex or empty",
            #width: &`Fill,
            &pattern
        ),
        pick_list(
            #on_select: |choice: string| mode <- select choice {
                "Include matches" => `Include,
                _ => `Exclude
            },
            #selected: &select mode {
                `Include => "Include matches",
                `Exclude => "Exclude matches"
            },
            &["Include matches", "Exclude matches"]
        )
    ]
);

let layout = column(
    #spacing: &10.0,
    #padding: &`All(20.0),
    #width: &`Fill,
    #height: &`Fill,
    &[
        text(#size: &20.0, &"Interactive filter + sort"),
        text(#size: &12.0, &"Click a column header to cycle its sort; click more than one for tie-broken multi-column sort."),
        controls,
        data_table(
            #sort_by: &sort_by,
            #on_header_click: |#column: string| cycle_sort(#column: column),
            #table: &tbl
        )
    ]
);

[&window(
    #icon: &icon::icon,
    #title: &"Data Table — Filter & Sort",
    #theme: &`CatppuccinMocha,
    &layout
)]
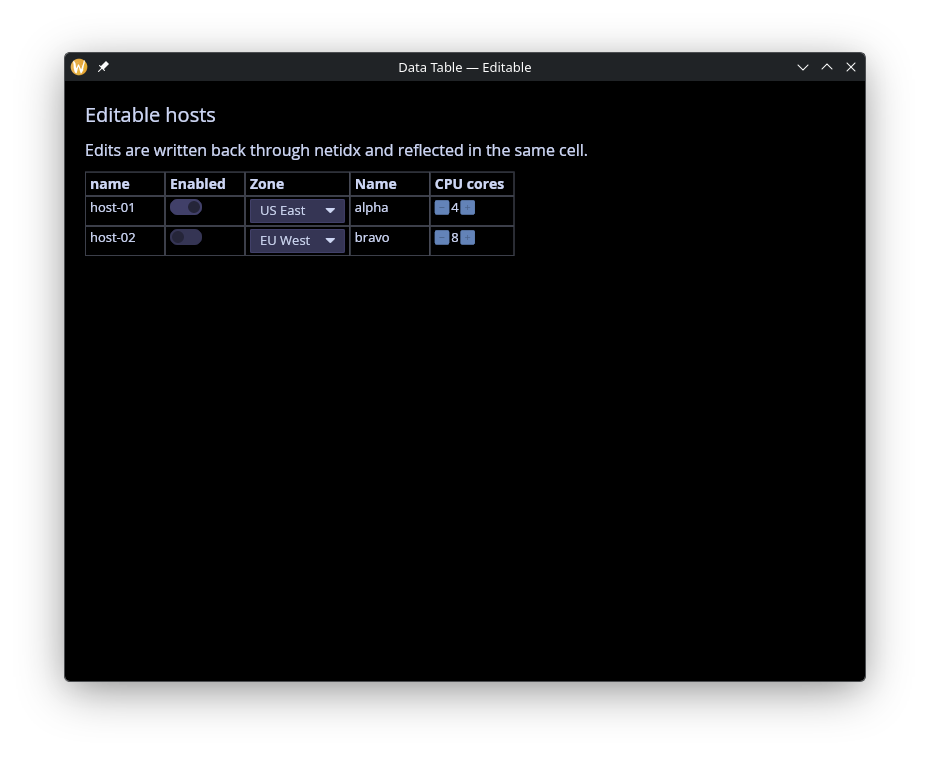
Editable
Every editable column type in one place: Text, Toggle, Combo,
Spin. Each cell is published with an on_write handler so edits
round-trip through netidx. The example shows the
array::map(raw_columns, …) pattern for attaching custom
ColumnSpecs to specific column names while leaving everything else
as bare-string Netidx-sourced columns.
use gui;
use gui::data_table;
use gui::column;
use gui::text;
use sys;
use sys::net;
mod icon;

// Four editable columns demonstrating every ColumnType that takes
// user input: Text, Toggle, Combo, Spin. Each cell is published with
// an #on_write handler so edits round-trip through netidx.

let host_01_name = "alpha";
let host_01_enabled = true;
let host_01_zone = "us-east-1";
let host_01_cpu = f64:4.0;

sys::net::publish(
    #on_write: |v: string| host_01_name <- v,
    "/local/graphix/data_table_editable/host-01/name",
    host_01_name
);
sys::net::publish(
    #on_write: |v: bool| host_01_enabled <- v,
    "/local/graphix/data_table_editable/host-01/enabled",
    host_01_enabled
);
sys::net::publish(
    #on_write: |v: string| host_01_zone <- v,
    "/local/graphix/data_table_editable/host-01/zone",
    host_01_zone
);
sys::net::publish(
    #on_write: |v: f64| host_01_cpu <- v,
    "/local/graphix/data_table_editable/host-01/cpu",
    host_01_cpu
);

let host_02_name = "bravo";
let host_02_enabled = false;
let host_02_zone = "eu-west-1";
let host_02_cpu = f64:8.0;

sys::net::publish(
    #on_write: |v: string| host_02_name <- v,
    "/local/graphix/data_table_editable/host-02/name",
    host_02_name
);
sys::net::publish(
    #on_write: |v: bool| host_02_enabled <- v,
    "/local/graphix/data_table_editable/host-02/enabled",
    host_02_enabled
);
sys::net::publish(
    #on_write: |v: string| host_02_zone <- v,
    "/local/graphix/data_table_editable/host-02/zone",
    host_02_zone
);
sys::net::publish(
    #on_write: |v: f64| host_02_cpu <- v,
    "/local/graphix/data_table_editable/host-02/cpu",
    host_02_cpu
);

// Map the resolver-derived columns array. Each editable column gets
// an explicit ColumnSpec; anything else (none expected here) passes
// through as a default Text/Netidx column.
let make_columns = |raw: Array<string>| array::map(raw, |name| select name {
    "name" => text_column(
        #name: "name",
        #on_edit: |#path: string, #value: Any|
            sys::net::write(path, value)$,
        #display_name: "Name"
    ),
    "enabled" => toggle_column(
        #name: "enabled",
        #on_edit: |#path: string, #value: bool|
            sys::net::write(path, value)$,
        #display_name: "Enabled"
    ),
    "zone" => combo_column(
        #name: "zone",
        #choices: [
            { id: "us-east-1", label: "US East" },
            { id: "us-west-2", label: "US West" },
            { id: "eu-west-1", label: "EU West" },
            { id: "ap-south-1", label: "Asia Pacific" }
        ],
        #on_edit: |#path: string, #value: string|
            sys::net::write(path, value)$,
        #display_name: "Zone"
    ),
    "cpu" => spin_column(
        #name: "cpu",
        #min: f64:1.0,
        #max: f64:64.0,
        #increment: f64:1.0,
        #on_edit: |#path: string, #value: f64|
            sys::net::write(path, value)$,
        #display_name: "CPU cores"
    ),
    other => other
});

let raw_tbl = sys::net::list_table("/local/graphix/data_table_editable")$;
let tbl = { rows: raw_tbl.rows, columns: make_columns(raw_tbl.columns) };

let selection: Array<string> = [];

let layout = column(
    #spacing: &12.0,
    #padding: &`All(20.0),
    #width: &`Fill,
    #height: &`Fill,
    &[
        text(#size: &20.0, &"Editable hosts"),
        text(&"Edits are written back through netidx and reflected in the same cell."),
        data_table(
            #selection: &selection,
            #on_select: |#path| selection <- [path],
            #table: &tbl
        )
    ]
);

[&window(
    #icon: &icon::icon,
    #title: &"Data Table — Editable",
    #theme: &`CatppuccinMocha,
    &layout
)]
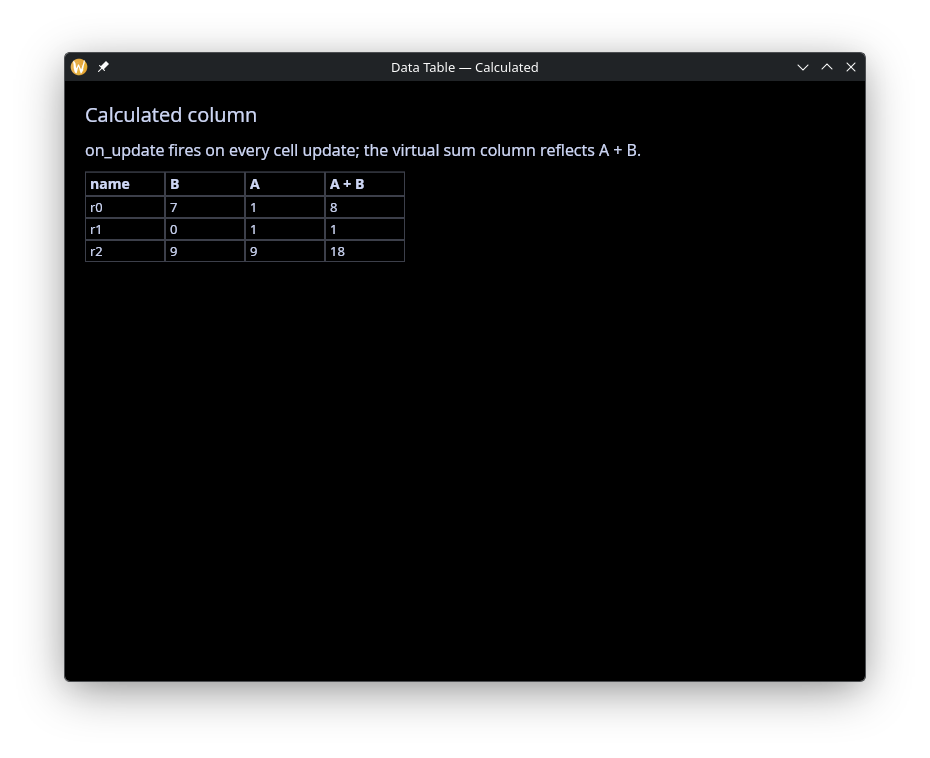
Calculated Columns
A virtual column whose source is a reactive Map<string, Any>,
rebuilt whenever any subscribed cell updates. Demonstrates deriving
per-row aggregates (here, sums) without touching netidx.
use gui;
use gui::data_table;
use gui::column;
use gui::text;
use str;
use sys;
use sys::net;
mod icon;

// Two published columns A and B. A virtual "sum" column has its
// per-cell value set from a let-bound Map; the `on_update` callback
// watches every subscribed cell update and pushes the new (a+b)
// total into the sum entry.

let rv = {
    let clock = time::timer(5, true);
    || any(1, rand::rand(#start:0, #end:10, #clock))
};

publish("/local/graphix/data_table_calculated/r0/A", rv());
publish("/local/graphix/data_table_calculated/r1/A", rv());
publish("/local/graphix/data_table_calculated/r2/A", rv());
publish("/local/graphix/data_table_calculated/r0/B", rv());
publish("/local/graphix/data_table_calculated/r1/B", rv());
publish("/local/graphix/data_table_calculated/r2/B", rv());

let raw_tbl = sys::net::list_table("/local/graphix/data_table_calculated")$;

let data: Map<string, Map<string, i64>> = {};

// Append a virtual `sum` column to the resolver-derived table. The
// bare strings from `sys::net::list_table` continue to mean "Netidx-
// sourced Text columns"; the new entry pulls its values from a let-
// bound Map updated by the on_update callback below.
//
// `array::map` with an explicit `-> [string, ColumnSpec]` return type
// widens each bare-string entry into the union element type before
// concat. Without the explicit return type, inference leaves the
// resulting array as `Array<string>` and fails to fit ColumnSpec.
let widened: Array<[string, ColumnSpec]> =
    array::map(raw_tbl.columns, |n: string| -> [string, ColumnSpec] n);
let tbl: Table = {
    rows: raw_tbl.rows,
    columns: array::push(widened, text_column(
        #name: "sum",
        #display_name: "A + B",
        #source: &opt::or_default(map::get(data, "sum"), {})
    ))
};

// on_update is called on updates to netidx subscriptions by the table.
let on_update = |#path: string, #value: Primitive| {
    let v = cast<i64>(value)$;
    let d = v ~ data; // run only when v updates
    let (row, col) = opt::or_never(str::row_col(path));
    let d = map::change(d, col, {}, |rows| map::insert(rows, row, v));
    let sum = map::fold(d, 0, |sum, (col, rows)| select col {
        "sum" => sum,
        col => sum + map::get_or(rows, row, 0)
    });
    data <- map::change(d, "sum", {}, |sums| map::insert(sums, row, sum))
};

let layout = column(
    #spacing: &12.0,
    #padding: &`All(20.0),
    #width: &`Fill,
    #height: &`Fill,
    &[
        text(#size: &20.0, &"Calculated column"),
        text(&"on_update fires on every cell update; the virtual sum column reflects A + B."),
        data_table(#on_update, #table: &tbl)
    ]
);

[&window(
    #icon: &icon::icon,
    #title: &"Data Table — Calculated",
    #theme: &`CatppuccinMocha,
    &layout
)]
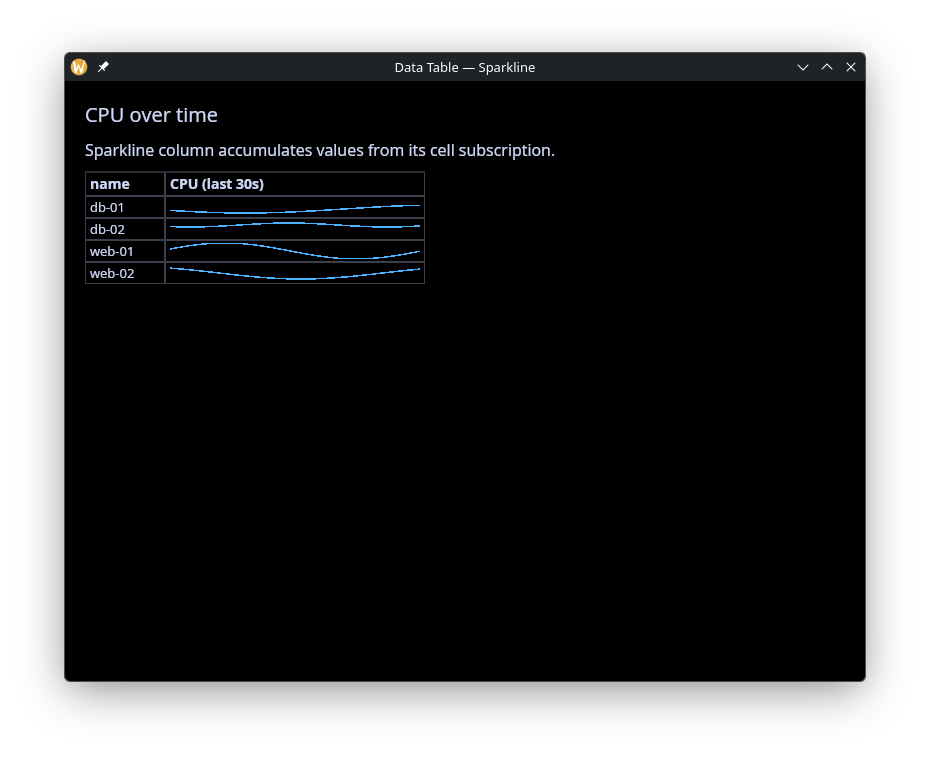
Sparkline
Live rolling charts per row with automatic column-wide y-axis sharing, so cells are visually comparable without the caller picking bounds.
use gui;
use gui::data_table;
use gui::column;
use gui::text;
use core::math;
use sys;
use sys::net;
use sys::time;
mod icon;

// Four rows, each publishing a cpu value that updates once a second
// on a sine-wave pattern staggered per row. The Sparkline column
// accumulates the history and draws a rolling chart.
let tick = time::timer(duration:1.s, true);
let t = cast<f64>(count(tick))$;

let cpu_1 = 0.0;
cpu_1 <- tick ~ 50.0 + 40.0 * math::sin(t / 4.0);

let cpu_2 = 0.0;
cpu_2 <- tick ~ 50.0 + 30.0 * math::sin((t + 10.) / 5.0);

let cpu_3 = 0.0;
cpu_3 <- tick ~ 40.0 + 20.0 * math::sin((t + 20.) / 6.0);

let cpu_4 = 0.0;
cpu_4 <- tick ~ 70.0 + 10.0 * math::sin((t + 30.) / 3.0);

sys::net::publish("/local/graphix/data_table_sparkline/web-01/cpu", cpu_1);
sys::net::publish("/local/graphix/data_table_sparkline/web-02/cpu", cpu_2);
sys::net::publish("/local/graphix/data_table_sparkline/db-01/cpu", cpu_3);
sys::net::publish("/local/graphix/data_table_sparkline/db-02/cpu", cpu_4);

let make_columns = |raw: Array<string>| array::map(raw, |name| select name {
    "cpu" => sparkline_column(
        #name: "cpu",
        #history_seconds: 30.0,
        #display_name: "CPU (last 30s)",
        #width: &260.0
    ),
    other => other
});

let raw_tbl = sys::net::list_table("/local/graphix/data_table_sparkline")$;
let tbl = { rows: raw_tbl.rows, columns: make_columns(raw_tbl.columns) };

let layout = column(
    #spacing: &12.0,
    #padding: &`All(20.0),
    #width: &`Fill,
    #height: &`Fill,
    &[
        text(#size: &20.0, &"CPU over time"),
        text(&"Sparkline column accumulates values from its cell subscription."),
        data_table(#table: &tbl)
    ]
);

[&window(
    #icon: &icon::icon,
    #title: &"Data Table — Sparkline",
    #theme: &`CatppuccinMocha,
    &layout
)]
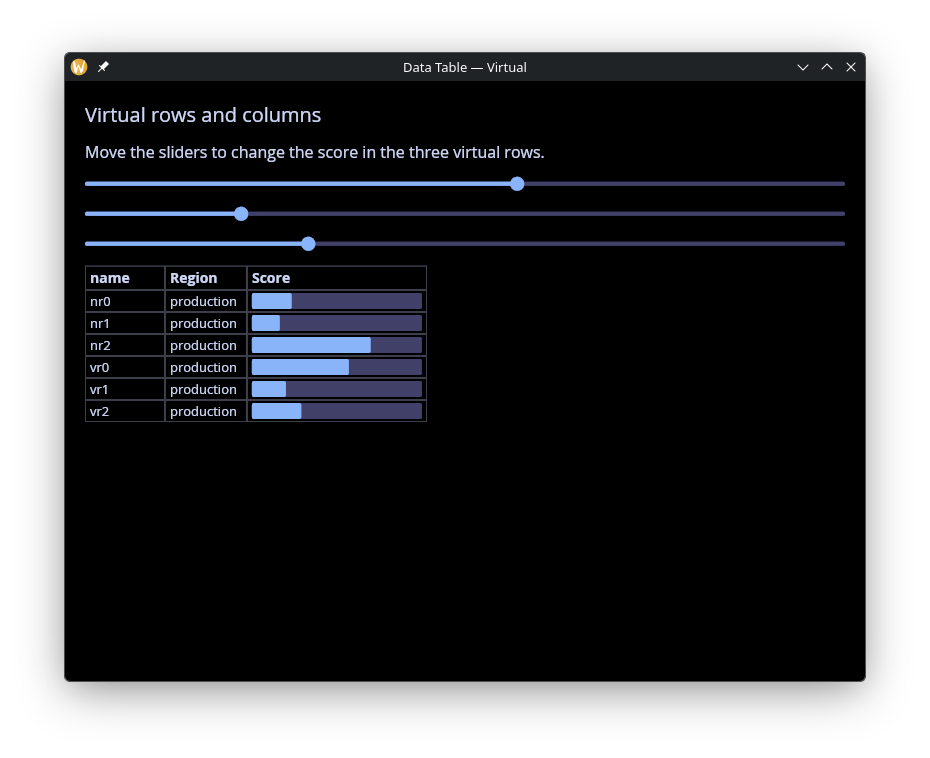
Virtual Rows and Columns
Mix live subscribed rows with virtual rows whose cells come from non-Netidx sources. Virtual-column-plus-virtual-row combinations give you fully client-side cells.
use gui;
use gui::data_table;
use gui::slider;
use gui::column;
use gui::text;
use sys;
mod icon;

let rv = {
    let clock = time::timer(5, true);
    || any(0.5, rand::rand(#start:0., #end:1., #clock))
};

net::publish("/local/graphix/data_table_virtual/nr0/score", rv());
net::publish("/local/graphix/data_table_virtual/nr1/score", rv());
net::publish("/local/graphix/data_table_virtual/nr2/score", rv());

let score: Map<string, f64> = {};

let tbl = {
    let raw = net::list_table("/local/graphix/data_table_virtual")$;
    let columns = array::map(raw.columns, |n| select n {
        "score" => progress_column(
            #name: "score",
            #display_name: "Score",
            #source: &`Netidx(score),
            #width: &f64:180.0
        ),
        n => n
    });
    let columns = array::push_front(columns, text_column(
        #name: "region",
        #display_name: "Region",
        #source: &"production"
    ));
    // rows that aren't absolute paths won't attempt to subscribe
    // but will be looked up in the score map for a default value.
    // that lets us add virtual rows that don't exist in netidx
    let rows = array::concat(raw.rows, ["vr0", "vr1", "vr2"]);
    uniq({ rows, columns })
};

let layout = column(
    #spacing: &14.0,
    #padding: &`All(20.0),
    #width: &`Fill,
    #height: &`Fill,
    &[
        text(#size: &20.0, &"Virtual rows and columns"),
        text(&"Move the sliders to change the score in the three virtual rows."),
        slider(
            #on_change: |v: f64| score <- v ~ map::insert(score, "vr0", v),
            #min: &f64:0.0, #max: &f64:1.0, #step: &f64:0.01,
            &map::get_or(score, "vr0", 0.)
        ),
        slider(
            #on_change: |v: f64| score <- v ~ map::insert(score, "vr1", v),
            #min: &f64:0.0, #max: &f64:1.0, #step: &f64:0.01,
            &map::get_or(score, "vr1", 0.)
        ),
        slider(
            #on_change: |v: f64| score <- v ~ map::insert(score, "vr2", v),
            #min: &f64:0.0, #max: &f64:1.0, #step: &f64:0.01,
            &map::get_or(score, "vr2", 0.)
        ),
        data_table(#table: &tbl)
    ]
);

[&window(
    #icon: &icon::icon,
    #title: &"Data Table — Virtual",
    #theme: &`CatppuccinMocha,
    &layout
)]
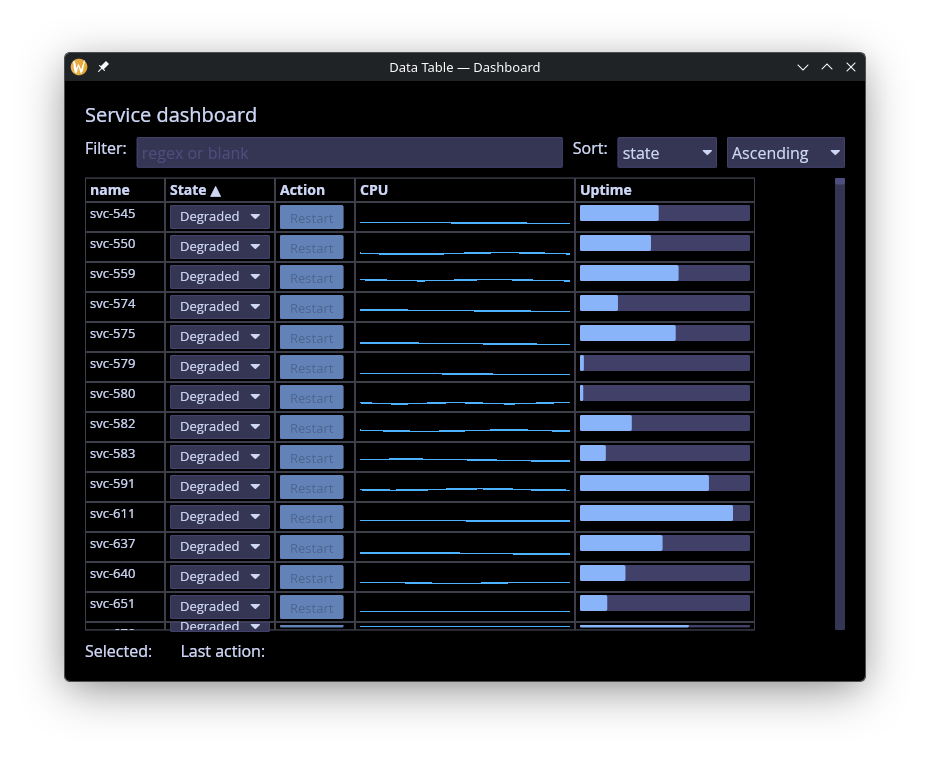
Dashboard
Kitchen-sink example combining Combo state pickers, Sparkline
CPU metrics, Progress uptime, a Button action column, a regex
row filter in a text input, sort controlled by pick-lists, and
selection echoed in the footer.
use gui;
use gui::data_table;
use gui::row;
use gui::column;
use gui::text;
use gui::text_input;
use gui::pick_list;
use core::math;
use array;
use opt;
use re;
use str;
use sys;
use sys::net;
use sys::time;
mod icon;

// Kitchen-sink example combining the main data_table features:
// * Combo column for state picklists
// * Sparkline column for rolling cpu metrics
// * Progress column for uptime %
// * Button column that fires an action callback
// * Regex row filter wired to a text input
// * Column sort driven by pick_list widgets in the sidebar
// * Selection echoed in the footer

let t = cast<f64>(count(time::timer(duration:1.s, true)))$;

type State = [`Healthy, `Degraded, `Down];

// Publish a tiny fleet of services. state is writable (Combo).
let svc = |#state:State, #cpu:f64, #uptime:f64, #name:string| {
    sys::net::publish(
        #on_write: |v: State| state <- v,
        "/local/graphix/data_table_dashboard/[name]/state",
        state
    );
    sys::net::publish("/local/graphix/data_table_dashboard/[name]/cpu", cpu);
    sys::net::publish("/local/graphix/data_table_dashboard/[name]/uptime", uptime);
    sys::net::publish("/local/graphix/data_table_dashboard/[name]/action", "Restart");
};

// single random number
let rn = |start: f64, end: f64| -> f64 rand::rand(#start, #end, #clock:1);

let published = array::init(1024, |i| svc(
    #name:"svc-[i]",
    #state:select rand::rand(#clock:1) {
        n if n <= 0.8 => `Healthy,
        n if n <= 0.9 => `Degraded,
        _ => `Down
    },
    #uptime:rn(0., 1.),
    #cpu:rn(0., 30.) + rn(1., 5.) * math::sin((t + rn(0., 5.)) / rn(1., 5.))
));

let last_action = "";

// Map the resolver-derived columns array. Bare-string entries
// (anything we don't recognize) pass through as default Text columns;
// the four named columns get their custom ColumnSpec.
let make_columns = |raw: Array<string>| array::map(raw, |name| select name {
    "state" => combo_column(
        #name: "state",
        #choices: [
            { id: "Healthy", label: "Healthy" },
            { id: "Degraded", label: "Degraded" },
            { id: "Down", label: "Down" }
        ],
        #on_edit: |#path: string, #value: string|
            sys::net::write(path, value)$,
        #display_name: "State",
        #width: &110.
    ),
    "cpu" => sparkline_column(
        #name: "cpu",
        #history_seconds: f64:30.0,
        #display_name: "CPU",
        #width: &220.0,
        #min:0.,
        #max:100.
    ),
    "uptime" => progress_column(
        #name: "uptime",
        #display_name: "Uptime",
        #width: &180.0
    ),
    "action" => button_column(
        #name: "action",
        #on_click: |#path: string, #value: Any|
            last_action <- "[path]",
        #display_name: "Action"
    ),
    other => other
});

// Caller-side filter: apply the regex to the Table's rows, then
// rewrap with the column specs.
let pattern = "";
let tbl: Table = {
    let raw = sys::net::list_table("/local/graphix/data_table_dashboard")$;
    let rows = select str::len(pattern) {
        n if n == 0 => raw.rows,
        _ => array::filter(raw.rows, |r| {
            let row = opt::or_default(str::basename(r), r);
            select re::is_match(#pat: pattern, row) {
                error as _ => false,
                b => b
            }
        })
    };
    { rows, columns: make_columns(raw.columns) }
};

let sort_col = "state";
let sort_dir: SortDirection = `Ascending;
let sort_by: Array<SortBy> = [{ column: sort_col, direction: sort_dir }];

// Selection + footer
let selection: Array<string> = [];

let controls = row(
    #spacing: &10.0,
    &[
        text(&"Filter:"),
        text_input(
            #on_input: |v| pattern <- v,
            #placeholder: &"regex or blank",
            #width: &`Fill,
            &pattern
        ),
        text(&"Sort:"),
        pick_list(
            #on_select: |v| sort_col <- v,
            #selected: &sort_col,
            &["state", "cpu", "uptime"]
        ),
        pick_list(
            #on_select: |v| sort_dir <- cast<SortDirection>(v)$,
            #selected: &cast<string>(sort_dir)$,
            &["Ascending", "Descending"]
        )
    ]
);

let footer = row(
    #spacing: &10.0,
    &[
        text(&"Selected:"),
        text(&"[selection[0]$]"),
        text(&"  Last action:"),
        text(&"[last_action]")
    ]
);

let layout = column(
    #spacing: &10.0,
    #padding: &`All(20.0),
    #width: &`Fill,
    #height: &`Fill,
    &[
        text(#size: &20.0, &"Service dashboard"),
        controls,
        data_table(
            #sort_by: &sort_by,
            #selection: &selection,
            #on_select: |#path: string| selection <- [path],
            #table: &tbl
        ),
        footer
    ]
);

[&window(
    #icon: &icon::icon,
    #title: &"Data Table — Dashboard",
    #theme: &`CatppuccinMocha,
    &layout
)]