The Bar Chart Widget
The barchart widget displays categorical data as vertical bars, supporting grouped bars, custom styling, and dynamic updates. It’s ideal for comparing values across categories, showing rankings, or displaying resource usage.
Interface
type Bar = {
  label: &[Line, null],
  style: &[Style, null],
  text_value: &[string, null],
  value: &i64,
  value_style: &[Style, null]
};

val bar: fn(
  ?#label: &[Line, null],
  ?#style: &[Style, null],
  ?#text_value: &[string, null],
  ?#value_style: &[Style, null],
  &i64
) -> Bar;

type BarGroup = {
  bars: Array<Bar>,
  label: [Line, null]
};

val bar_group: fn(
  ?#label: [Line, null],
  Array<Bar>
) -> BarGroup;

val bar_chart: fn(
  ?#bar_gap: &[i64, null],
  ?#bar_style: &[Style, null],
  ?#bar_width: &[i64, null],
  ?#direction: &[Direction, null],
  ?#group_gap: &[i64, null],
  ?#label_style: &[Style, null],
  ?#max: &[i64, null],
  ?#style: &[Style, null],
  ?#value_style: &[Style, null],
  &Array<BarGroup>
) -> Tui;
Parameters
bar_chart
- max - Maximum value for chart scale (auto-scales if not specified)
- bar_width - Width of each bar in characters
- bar_gap - Space between bars within a group
- group_gap - Space between bar groups
- style - Base style for the chart
bar_group
- label - Line labeling the group (displayed below bars)
bar
- style - Style for the bar
- label - Line labeling the bar
- text_value - Line displayed above bar (defaults to numeric value)
Examples
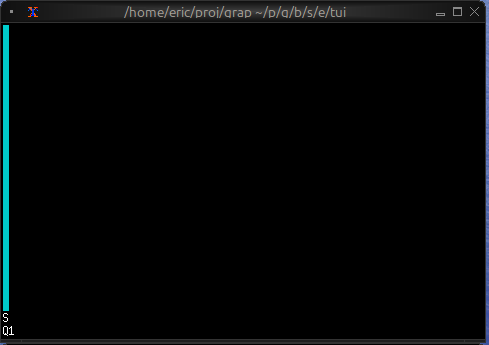
Basic Usage
use tui;
use tui::barchart;

let bar1 = bar(
    #style: &style(#fg: `Cyan),
    #label: &line("Sales"),
    &42
);

bar_chart(&[bar_group(#label: line("Q1"), [bar1])])
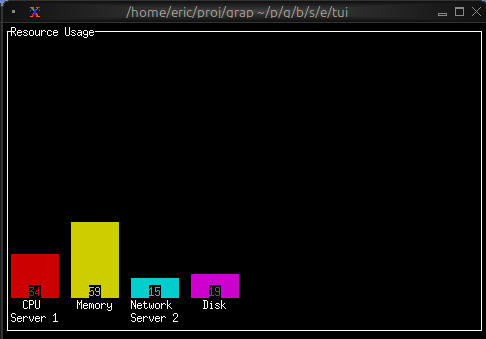
Grouped Bars with Dynamic Data
use tui;
use tui::barchart;
use tui::block;
use rand;

let clock = time::timer(duration:0.7s, true);

let group0 = [
    bar(#style: &style(#fg: `Red), #label: &line("CPU"), &rand(#start:0, #end:100, #clock)),
    bar(#style: &style(#fg: `Yellow), #label: &line("Memory"), &rand(#start:25, #end:200, #clock))
];

let group1 = [
    bar(#style: &style(#fg: `Cyan), #label: &line("Network"), &rand(#start:0, #end:50, #clock)),
    bar(#style: &style(#fg: `Magenta), #label: &line("Disk"), &rand(#start:1, #end:25, #clock))
];

let chart = bar_chart(
    #bar_gap: &2,
    #bar_width: &8,
    #max: &200,
    &[
        bar_group(#label: line("Server 1"), group0),
        bar_group(#label: line("Server 2"), group1)
    ]
);

block(#border: &`All, #title: &line("Resource Usage"), &chart)
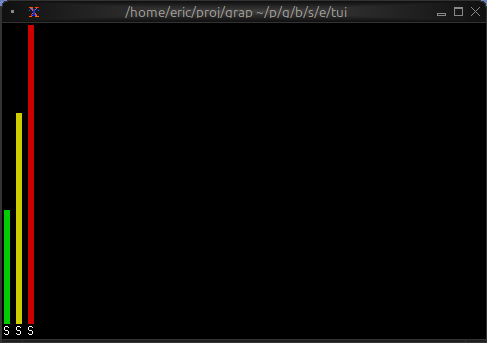
Color-coded Values
use tui;
use tui::barchart;

let make_colored_bar = |label, value| {
    let color = select value {
        v if v > 80 => `Red,
        v if v > 50 => `Yellow,
        _ => `Green
    };
    bar(#style: &style(#fg: color), #label: &line(label), &value)
};

let bars = [
    make_colored_bar("Service A", 35),
    make_colored_bar("Service B", 65),
    make_colored_bar("Service C", 92)
];

bar_chart(&[bar_group(bars)])