The Canvas Widget
The canvas widget provides a low-level drawing surface for custom graphics. You can draw lines, circles, rectangles, points, and text labels at specific coordinates, making it perfect for diagrams, plots, and custom visualizations.
Interface
type CanvasLine = {
  color: Color,
  x1: f64,
  x2: f64,
  y1: f64,
  y2: f64
};

type CanvasCircle = {
  color: Color,
  radius: f64,
  x: f64,
  y: f64
};

type CanvasRectangle = {
  color: Color,
  height: f64,
  width: f64,
  x: f64,
  y: f64
};

type CanvasPoints = {
  color: Color,
  coords: Array<(f64, f64)>
};

type CanvasLabel = {
  line: Line,
  x: f64,
  y: f64
};

type CanvasShape = [
  `Line(CanvasLine),
  `Circle(CanvasCircle),
  `Rectangle(CanvasRectangle),
  `Points(CanvasPoints),
  `Label(CanvasLabel)
];

val canvas: fn(
  ?#background_color: &[Color, null],
  ?#marker: &[Marker, null],
  #x_bounds: &{ max: f64, min: f64 },
  #y_bounds: &{ max: f64, min: f64 },
  &Array<&CanvasShape>
) -> Tui;
Parameters
- background_color - Background color for the canvas
- marker - Marker type:
Dot,Braille(default), orBlock - x_bounds - X-axis range with
minandmaxfields (required) - y_bounds - Y-axis range with
minandmaxfields (required)
Shape Types
Line
`Line({color: `Red, x1: 0.0, y1: 0.0, x2: 10.0, y2: 5.0})
Circle
`Circle({color: `Blue, x: 5.0, y: 5.0, radius: 2.0})
Rectangle
`Rectangle({color: `Green, x: 2.0, y: 2.0, width: 3.0, height: 4.0})
Points
`Points({color: `Yellow, coords: [(1.0, 1.0), (2.0, 3.0), (3.0, 1.5)]})
Label
`Label({line: line("Hello"), x: 5.0, y: 0.5})
Examples
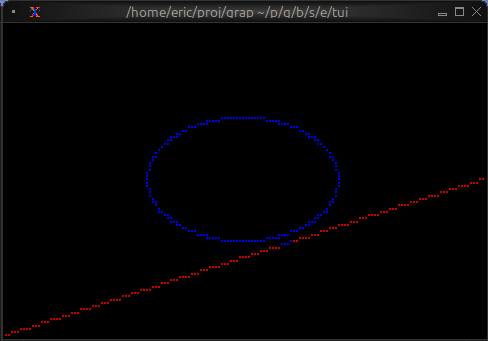
Basic Usage
use tui;
use tui::canvas;

let line = `Line({color: `Red, x1: 0.0, y1: 0.0, x2: 10.0, y2: 5.0});
let circle = `Circle({color: `Blue, x: 5.0, y: 5.0, radius: 2.0});

canvas(
    #x_bounds: &{min: 0.0, max: 10.0},
    #y_bounds: &{min: 0.0, max: 10.0},
    &[&line, &circle]
)
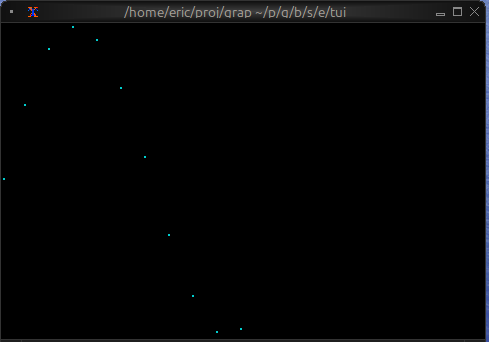
Function Plotting
use tui;
use tui::canvas;

let coords = [
    (0.0, 0.0), (0.5, 0.48), (1.0, 0.84), (1.5, 1.0),
    (2.0, 0.91), (2.5, 0.60), (3.0, 0.14), (3.5, -0.35),
    (4.0, -0.76), (4.5, -0.98), (5.0, -0.96)
];

let plot = `Points({color: `Cyan, coords});

canvas(
    #x_bounds: &{min: 0.0, max: 10.0},
    #y_bounds: &{min: -1.0, max: 1.0},
    &[&plot]
)
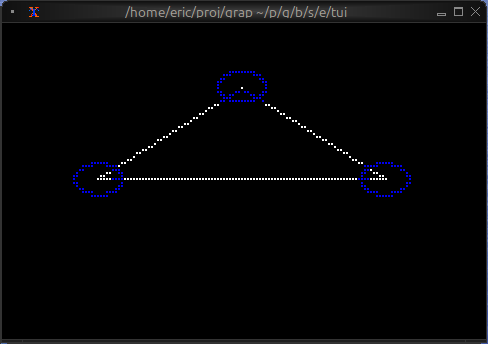
Network Diagram
use tui;
use tui::canvas;
use tui::text;

let circle1 = `Circle({color: `Blue, x: 2.0, y: 5.0, radius: 0.5});
let circle2 = `Circle({color: `Blue, x: 8.0, y: 5.0, radius: 0.5});
let circle3 = `Circle({color: `Blue, x: 5.0, y: 8.0, radius: 0.5});

let line1 = `Line({color: `White, x1: 2.0, y1: 5.0, x2: 8.0, y2: 5.0});
let line2 = `Line({color: `White, x1: 2.0, y1: 5.0, x2: 5.0, y2: 8.0});
let line3 = `Line({color: `White, x1: 8.0, y1: 5.0, x2: 5.0, y2: 8.0});

let all_shapes = [&line1, &line2, &line3, &circle1, &circle2, &circle3];

canvas(
    #x_bounds: &{min: 0.0, max: 10.0},
    #y_bounds: &{min: 0.0, max: 10.0},
    &all_shapes
)
Animated Graphics
use tui;
use tui::canvas;

let clock = time::timer(duration:0.1s, true);
let x = 0.0;
x <- {
    let new_x = (clock ~ x) + 0.1;
    select new_x > 10.0 { true => 0.0, false => new_x }
};

let moving_circle = `Circle({color: `Red, x, y: 5.0, radius: 1.0});

canvas(
    #x_bounds: &{min: 0.0, max: 10.0},
    #y_bounds: &{min: 0.0, max: 10.0},
    &[&moving_circle]
)
Marker Comparison
- Braille: Highest resolution, smoothest curves, best for detailed graphics
- Dot: Fast rendering, lower resolution, good for simple shapes
- Block: High contrast, blocky appearance, good for filled areas
Coordinate System
- Origin (0, 0) is at the bottom-left
- X increases to the right
- Y increases upward
- Shapes outside bounds are clipped